Answer of Question 1
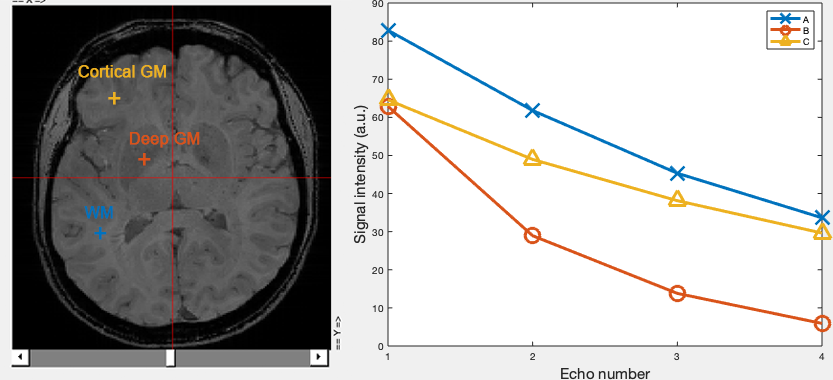
White mater (WM) has the strongest signal intensity at the 1st echo corresponding to curve A. Cortical grey matter (cortical GM) and deep grey matter (deep GM) have similar signal intensity at the 1st echo, yet the signal intensity of deep GM at the later echoes are the weakest among all locations so it corresponds to curve B and cortical GM corresponds to curve C.
The plot of signal variation over time in the right actually tells us some information about magnetic susceptibility. It is well-known that deep grey matter such that globus pallidus has high iron content. Those irons, stored in ferritin, are paramagnetic substances that can create a relatively strong (local) magnetic field, in turns speeding up the dephasing effect of water protons in the tissue and making the darker appearance in the images. Given the contrast observed from the magnitude data can also be magnetic susceptibility related, though QSM mainly works with phase images, magnitude images can be very useful because they share similar (but not always the same!) contrasts, therefore, have the potential to improve the quality of QSM maps.
Back to Exercise 1.