(f)MRI Toolkit 2025
Objectives
Understanding the data needed for R2* and QSM mapping;
Gaining experience in basic QSM processing and some of the intermediate steps and data generated;
Generating SWI images from multi-echo data;
Target Audience
who is new to SEPIA
who wants to learn ao to create an R2* or QSM pipeline using SEPIA
Estimated Time
About 1 hour
Introduction
In this tutorial, we will discuss the data required to obtain R2* and quantitative susceptibility mapping (QSM). This are two qunatitative methods that give insight to the tissue magnetic properties.
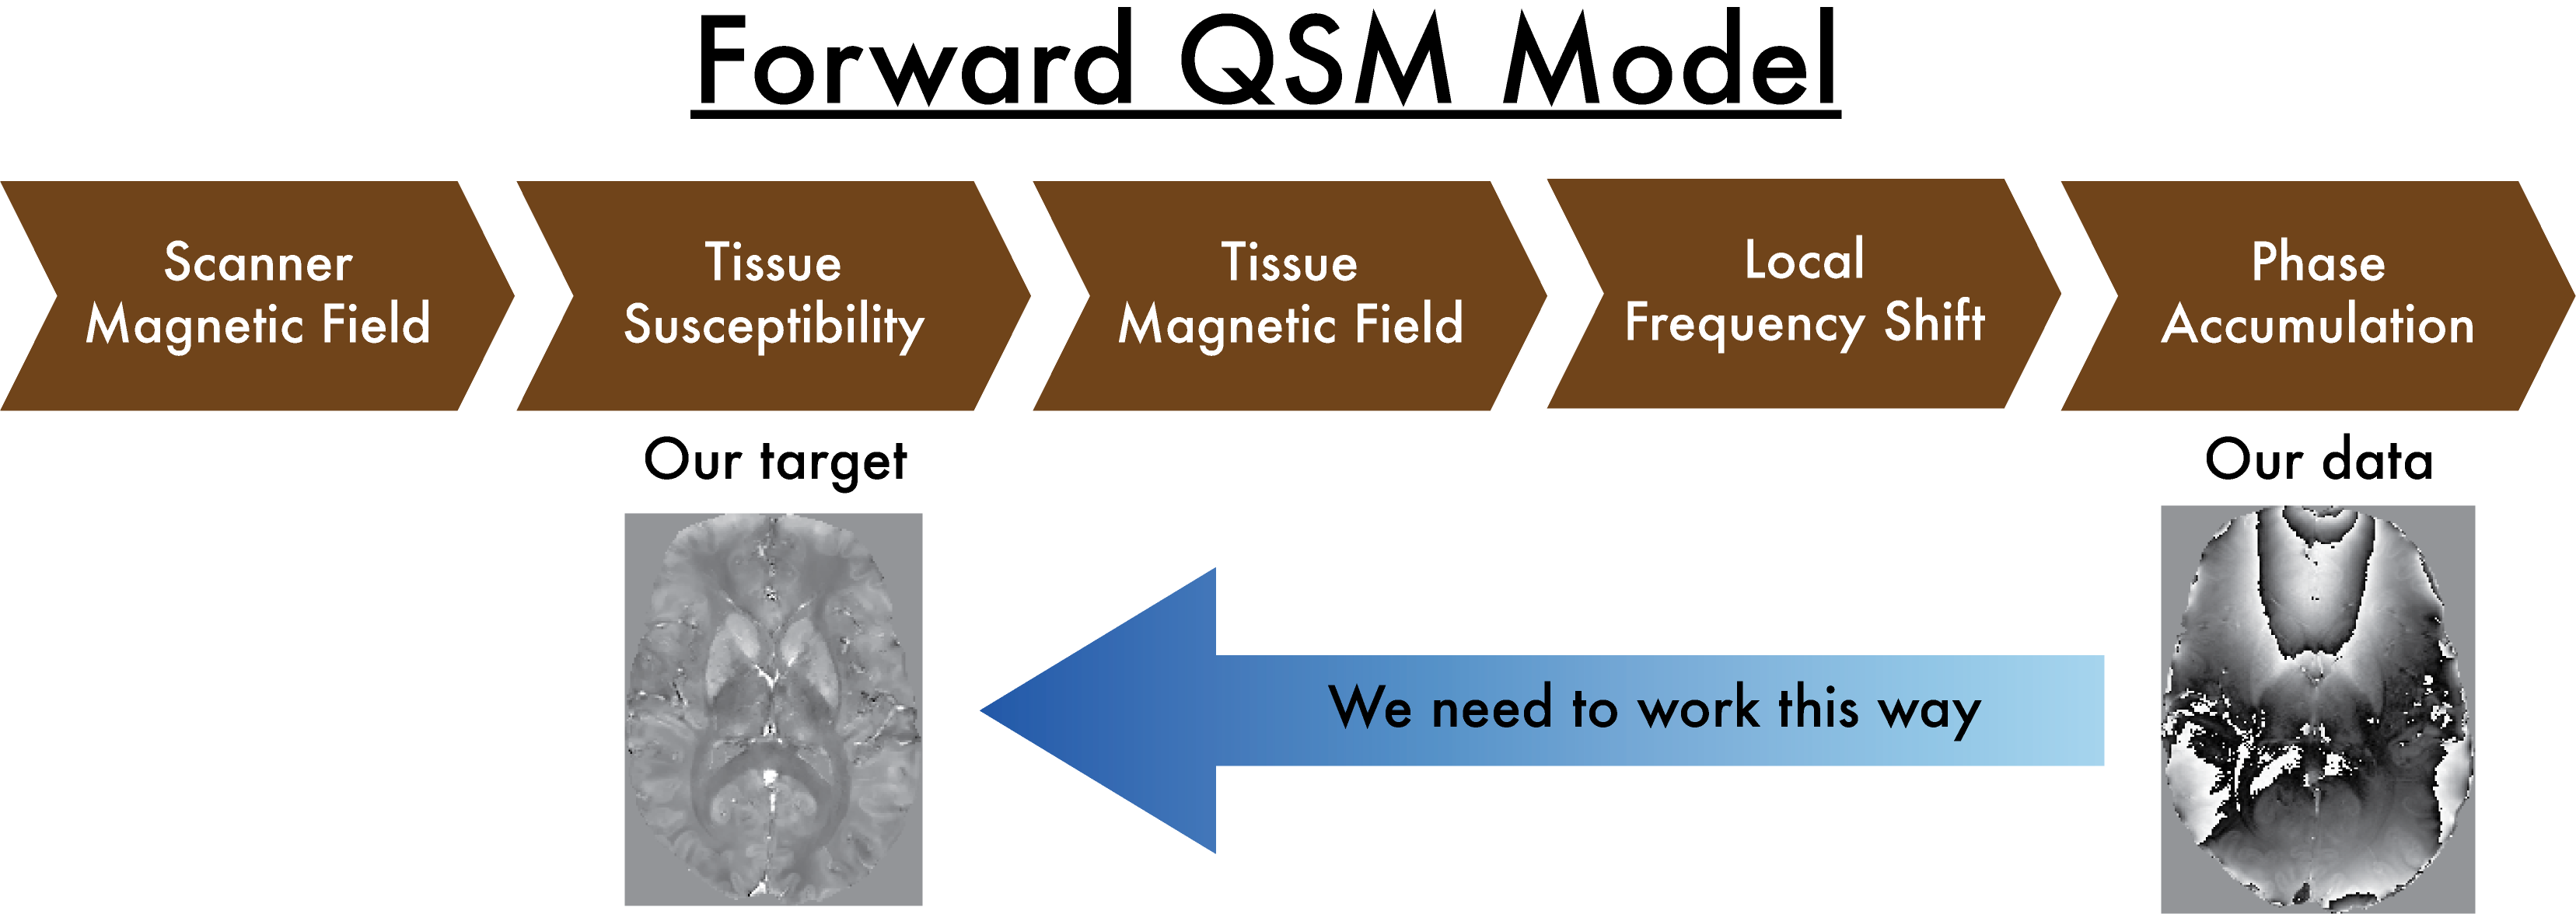
Figure 1: The QSM theory. A magnetic source generates a secondary magnetic field inside the MRI scanner, which will eventually alter the signal phase we measured. Decoding the phase images allows us to detect the molecular environment of the brain tissues.
Exercises
- Let’s begin with the following exercises:
1 to familiarize you with Multi-Echo data;
2 to start SEPIA and obtain an R2* map;
3 to run a complete QSM pipeline in SEPIA and visualize intermediate data;
4 to rerun the final step of QSM and compare various quantitative maps;
5 to use SEPIA to obtain synthetic images also derived from the same multi-echo data