Exercise 5
Objectives
Create synthetic images as those often required by radiologists to increase the visibility of hemorrages and vein structures
Estimated time
About 5 min.
Data Required
a 4D raw phase data (phase.nii.gz in the input directory)
a 4D raw magnitude data (mag.nii.gz in the input directory)
a SEPIA header (Sepia_header.mat in the input directory)
Clear SWI (Susceptibility Weighted Imaging)
While quantitative imaging has many interesting properties, MDs often value more an image that clearly shows something clinically relevant… even it somewhat exagerated.
SWI creates an image that enhances venous structures by combining the magnitude and the phase data in a creative way!
As by now you are an expert on SEPIA, simply follow the instructions bellow

In the I/O panel:
Select the Input Phase: ~/QuantitativeTutorial/data/phase.nii.gz
Select the Magnitude: ~/QuantitativeTutorial/data/mag.nii.gz
Select the SEPIA header: ~/QuantitativeTutorial/data/sepia_header.mat
Change the Output basename to: ~/QuantitativeTutorial/outputClearSWI/Sepia
On the SWI/SMWI pannnel #. Select the Method: Clear SWI #. Select Unwrapping Algorithm: ROMEO #. Type on Echoes to include: 1:5
On the fsleyes window you can now open an image Sepia_clearswi-minIP.nii.gz
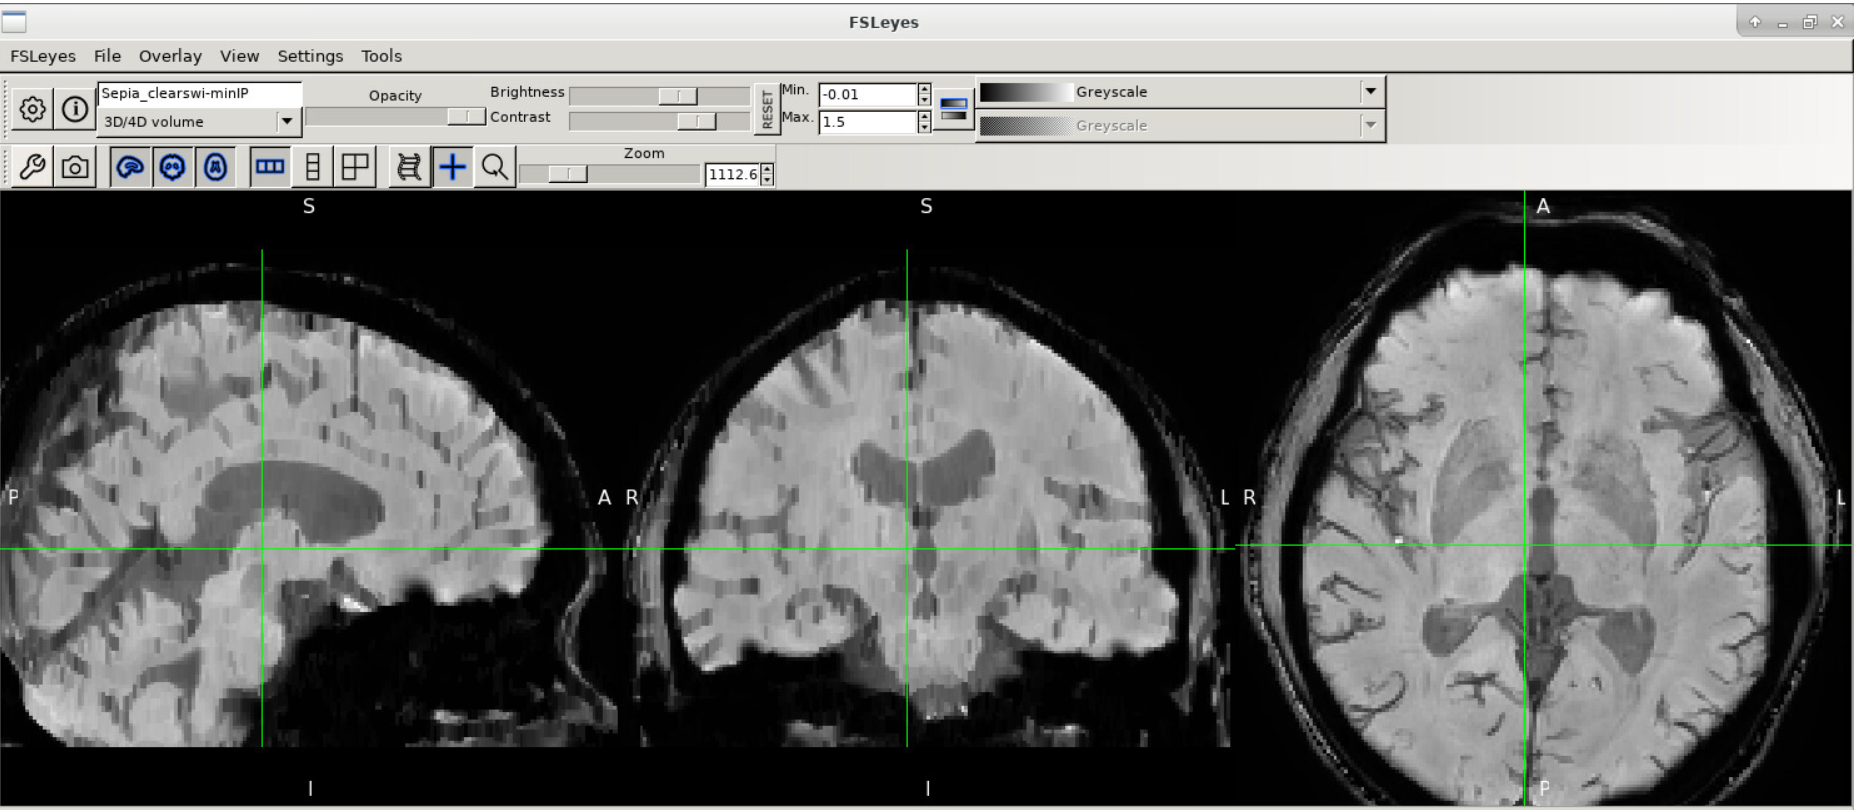
This image combines the standard magnitude image with phase information that enhances (by reducing the signal) not only deep gray matter regions, but also all venous structures! While it is usefull to visualize venous malformations or hemorrages, the values in the images are meaningless!
There are many other ways to create synthetic including using some of the quantitative maps as in SMWI… but that will be another tutorial :)